Transit Reachability Analyser
Plugin ID: 3475
Using OpenTripPlanner to calculate public transport reachability from a starting point to all stops in a GTFS feed.
(1) votes
Download latest
This plugin has an experimental version available!
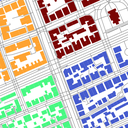
With the Transit Reachability Analyser plugin, one can calculate and visualize the reachability of public transport. The itineraries are calculated by OpenTripPlanner. As a result, a point layer with an attribute table is created, providing various information for each station. The results can be displayed as a heatmap. If a polygon layer is generated based on the point layer, it can also be colored in the various color schemes provided by the plugin. Reachability is represented using the indicators travel time, travel time ratio, frequency, walking time, and transfer count.
| Version | QGIS >= | QGIS <= | Date | |||
|---|---|---|---|---|---|---|
| v1.0.0-beta | 3.0.0 | 3.99.0 | 719 | julek | 2024-08-19T18:54:00.919555+00:00 |